Salesforce Developer Tools: How to work with Salesforce Lightning Inspector
Looking for Salesforce Training & HandsOn Projects?
Trailblazer Profile | LinkedIn | Salesforce Blog | Facebook | Youtube Channel | WhatsApp Community
Salesforce Lightning Inspector (SLI) is a chrome extension
that comes under the Developer Tools category. Being a Salesforce Lightning
Component developer it is really important to get familiar with these
productivity tools.
SLI offers loads of vital information about the lightning
applications & components running in your chrome browser.
In this article, we will explore this tool and try to
understand use cases where this developer tool can be a real time saver.
To start with this tool, we need to find in the Chrome Store
& install it as an extension to the browser.
Step-1: We can google "salesforce lightning inspector" to
get to the link
Step-2: Most of the time you will find it as the first entry
in your search results. Click on the link and go to the installation page
Step-3: Click on the “Add to Chrome” button to start the
installation for the extension
Step-4: Review the terms & conditions
Step-5: Click the “Add Extension” button to add it to the
Chrome browser
Step-6: We can see the SLI added to the list of extensions
for your browser
Step-7: To showcase the capability of Salesforce Lightning Inspector, I have created a simple lightning component that we will be walking throughout this article
Step-8: Once we have the component loaded into the browser
we can launch the developer tool by pressing “F12”. There we can see a few of
the tabs and one of them would be by the name “Lightning”
Step-9: Once we click the “Lightning” tab, this will make
more subtabs visible for you to use and that is where we will spend most of our
time
Step-11 & 12: In the Component Tree view we can hover on any UI element and the respective HTML would be highlighted as shown. This is helpful to investigate the rendered HTML elements on the browser
Step-13: In the “Attributes” section we can see all the
attributes related to the highlighted element on the component UI. This gives
quick access to the run time values of those attributes and could be helpful
during debugging
Step-14: In the “Performance” Tab we can the overall
performance of the component. This tab shows a nice graphical summary of how
different parts of the component are loaded in the browser. This can be helpful
to understand if the component needs more tuning for an effective load scenario
Step-15: In the “Chart View” we can view the graphical
representation for each moving part of the component individually (so cool)
Step-16: Just below the “Chart View” we can see the summary
of the overall page load that can help us to understand the overall rendering
performance
Step-17: In the “Transactions” Tab we can review and
transaction maintained by the component within the browser
Step-18: “Transactions” come with a variety of functionality
like to Start & Stop Transaction, Replay Transaction, Delete Transactions
& Filters Transactions
Step-19: We can review the “Context” tray just below the
controls. This is the place where we can review the data related to the
transactions
Step-20: “Event Log” is one of the most important tabs where
you will get most of the help around runtime variables (Aura Attributes or LWC
JS Properties). You will need to visit this tab more frequently during the
development to check for the runtime values now and then
Step-21: “Event Log” comes with a functionality set
including “Record Logs”, “Delete Logs”, “Filter Logs”, “Quick Filters”. For
example, to capture the log within the browser, make use of the “Record Event
Logs” button
Step-22: Just below the toolbar we can see the details panel
where all the fired events are being listed. You can expand each of the events
to check what data it contains in it
Step-23 & 24: For example, we can expand the “valuechange”
event, this gives us access to the setup of runtime variables like who was the
caller, what the source was, and how much time it took to execute
Step-25: This is yet another important view where we view the full call stack that helps you to understand the Source and Handler respective to the event
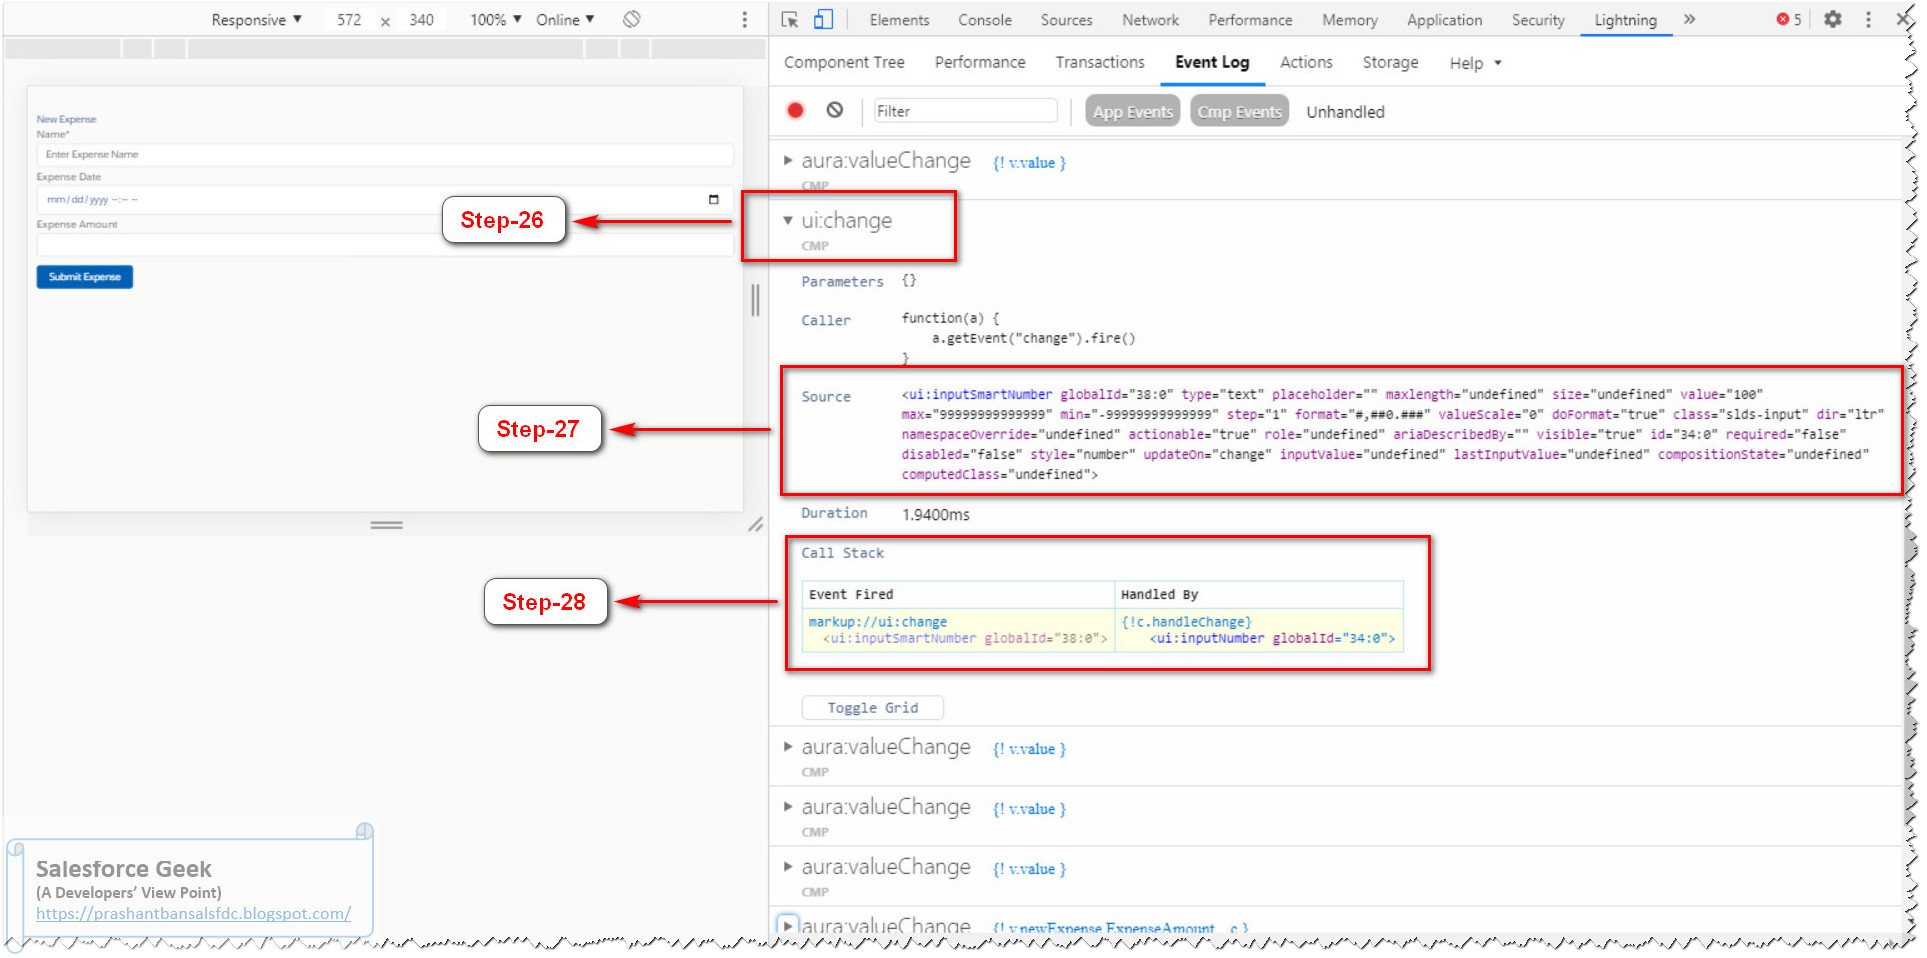
Step-26: Similarly we can repeat the same steps for
“ui:change” event too.
Step-27: Since each even can have its own set of data, we
can see the data values less or more than other events depending on what kind
of event are we investigating currently
Step-28: Like always full call stack helps you to understand the Source and Handler respective to the event. In this example, we can see the “ui:change” event is handled by “handleChange” JS Controller function
Step-29: The “Actions” Tab list out all the Server Side
Actions (Apex Actions) that are being used by this component
Step-30: The “Actions” tab comes with an additional toolbar
that allows you to record, delete & filter actions based on the usage
Step-31: We can also see a collapsible panel for each of the
Actions Status.
Step-32: For example, under the “Completed” section we can see one action listed that was executed successfully
Step-33: If we expand action details we can see the captured data associated with this as shown below
Step-34: Also we can make use of the “Console” tab that
comes as OOB implementations with any browser
Step-35: You can click it to open the Console details pane
Step-36 - 39: We can add the “console.log” statements in the
client-side code to surface any runtime info on to the console details pane
Note: Be careful of what are you exposing in “console.log” statements. You must clear all “console.log“ statements before packing the app to ensure security & integrity


Comments
Post a Comment